 |
OpenMS
|
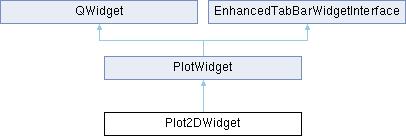
Widget for 2D-visualization of peak map and feature map data. More...
#include <OpenMS/VISUAL/Plot2DWidget.h>
Public Types | |
| typedef LayerDataBase::ExperimentSharedPtrType | ExperimentSharedPtrType |
| Main managed data type (experiment) | |
 Public Types inherited from PlotWidget Public Types inherited from PlotWidget | |
| typedef LayerDataBase::ExperimentType | ExperimentType |
| Main data type (experiment) | |
| typedef LayerDataBase::FeatureMapType | FeatureMapType |
| Main data type (features) | |
| typedef ExperimentType::SpectrumType | SpectrumType |
| Spectrum type. | |
Public Slots | |
| void | recalculateAxes_ () override |
| void | toggleProjections () |
| Toggles the visibility of the projections (convenience wrapper around setProjectionsVisible()) | |
| void | setProjectionsVisible (bool visible) |
| void | showGoToDialog () override |
| Public Slots inherited from PlotWidget | |
| void | showStatistics () |
| Shows statistics about the data (count, min, max, avg of intensity, charge, quality and meta data) | |
| void | showIntensityDistribution (const Math::Histogram<> &dist) |
| Shows the intensity distribution of the current layer. | |
| void | showMetaDistribution (const std::string &name, const Math::Histogram<> &dist) |
Shows the meta data distribution of value name of the current layer. | |
| void | updateAxes () |
| Updates the axes by setting the right labels and calling recalculateAxes_();. | |
| void | updateHScrollbar (float min, float disp_min, float disp_max, float max) |
| Updates the horizontal scrollbar. | |
| void | updateVScrollbar (float min, float disp_min, float disp_max, float max) |
| Updates the vertical scrollbar. | |
| virtual void | showGoToDialog ()=0 |
| Shows a goto dialog. | |
| void | changeLegendVisibility () |
| Toggles the axis legend visibility. | |
Signals | |
| void | visibleAreaChanged (DRange< 2 > area) |
| Signal emitted whenever the visible area changes. | |
| void | showSpectrumAsNew1D (int index) |
Requests to display the spectrum with index index in 1D. | |
| void | showChromatogramsAsNew1D (std::vector< int, std::allocator< int > > indices) |
| void | showCurrentPeaksAs3D () |
| Requests to display all spectra as 1D. | |
| void | showCurrentPeaksAsIonMobility (const MSSpectrum &spec) |
| Requests to display this spectrum (=frame) in ion mobility plot. | |
| void | projectionsVisibilityChanged (bool visible) |
| Signals inherited from PlotWidget | |
| void | sendStatusMessage (std::string, OpenMS::UInt) |
Emits a status message that should be displayed for time ms. If time is 0 the message should be displayed until the next message is emitted. | |
| void | sendCursorStatus (const std::string &x_value, const std::string &y_value) |
| Emitted when the cursor position changes (for displaying e.g. in status bar) | |
| void | aboutToBeDestroyed (int window_id) |
| Message about the destruction of this widget. | |
| void | openPreferences () |
| Shows the main preferences dialog. | |
| void | dropReceived (const QMimeData *data, QWidget *source, int id) |
| Signal that is emitted, when a drag-and-drop action ends on this widget. | |
Public Member Functions | |
| Plot2DWidget (const Param &preferences, QWidget *parent=nullptr) | |
| Default constructor. | |
| ~Plot2DWidget () override=default | |
| Destructor. | |
| Plot2DCanvas * | canvas () const override |
| Returns a pointer to canvas object. | |
| const Plot1DWidget * | getProjectionOntoX () const |
| const reference to the horizontal projection | |
| const Plot1DWidget * | getProjectionOntoY () const |
| const reference to the vertical projection | |
| bool | projectionsVisible () const |
| Returns if one of the projections is visible (or both are visible) | |
| void | setMapper (const DimMapper< 2 > &mapper) override |
| Public Member Functions inherited from PlotWidget | |
| PlotWidget (const Param &preferences, QWidget *parent=nullptr) | |
| Default constructor. | |
| ~PlotWidget () override | |
| Destructor. | |
| virtual AxisWidget * | xAxis () |
| Returns a pointer to the x-axis axis widget. | |
| virtual AxisWidget * | yAxis () |
| Returns a pointer to the y-axis axis widget. | |
| Int | getActionMode () const |
| Get the mouse action mode. | |
| virtual bool | isLegendShown () const |
| Returns if the axis labels are shown. | |
| virtual void | showLegend (bool show) |
| Shows/hides axis labels. | |
| void | setIntensityMode (PlotCanvas::IntensityModes mode) |
| Sets the intensity mode of the PlotCanvas. | |
| virtual void | hideAxes () |
| Hides x-axis and y-axis. | |
| virtual void | saveAsImage () |
| Saves the widget's content as image file. | |
| Public Member Functions inherited from EnhancedTabBarWidgetInterface | |
| EnhancedTabBarWidgetInterface () | |
| C'tor; creates a new ID;. | |
| virtual | ~EnhancedTabBarWidgetInterface () |
| Destructor (emits SignalProvider::aboutToBeDestroyed) | |
| void | addToTabBar (EnhancedTabBar *const parent, const std::string &caption, const bool make_active_tab=true) |
| Int | getWindowId () const |
| get the EnhancedTabBar unique window id | |
Protected Member Functions | |
| void | projectionInfo_ (int peaks, double intensity, double max) |
| shows projections information | |
| Protected Member Functions inherited from PlotWidget | |
| void | closeEvent (QCloseEvent *e) override |
| void | setCanvas_ (PlotCanvas *canvas, UInt row=0, UInt col=2) |
| Adds the canvas, axes and scrollbars to the layout. | |
| virtual void | intensityModeChange_ () |
| Switch between different intensity modes. | |
| virtual void | recalculateAxes_ ()=0 |
| recalculates the Axis ticks | |
| void | dragEnterEvent (QDragEnterEvent *event) override |
| void | dragMoveEvent (QDragMoveEvent *event) override |
| void | dropEvent (QDropEvent *event) override |
| void | paintEvent (QPaintEvent *) override |
| make our subclassed QWidget listen to things like stylesheet changes | |
Protected Attributes | |
| Plot1DWidget * | projection_onto_X_ |
| Vertical projection widget. | |
| Plot1DWidget * | projection_onto_Y_ |
| Horizontal projection widget. | |
| QGroupBox * | projection_box_ |
| Group box that shows information about the projections. | |
| QLabel * | projection_peaks_ |
| Number of peaks of the projection. | |
| QLabel * | projection_sum_ |
| Intensity sum of the projection. | |
| QLabel * | projection_max_ |
| Intensity maximum of the projection. | |
| QCheckBox * | projections_auto_ |
| Checkbox that indicates that projections should be automatically updated (with a slight delay) | |
| QTimer * | projections_timer_ |
| Timer that triggers auto-update of projections. | |
| Protected Attributes inherited from PlotWidget | |
| PlotCanvas * | canvas_ |
| Pointer to the canvas widget. | |
| QGridLayout * | grid_ |
| Main layout. | |
| AxisWidget * | y_axis_ |
| Vertical axis. | |
| AxisWidget * | x_axis_ |
| Horizontal axis. | |
| QScrollBar * | x_scrollbar_ |
| Horizontal scrollbar. | |
| QScrollBar * | y_scrollbar_ |
| Vertical scrollbar. | |
Private Slots | |
| void | showProjections_ (const LayerDataBase *source_layer) |
extracts the projections from the source_layer and displays them | |
| void | refreshProjections_ () |
| re-extracts the projections for the now-current layer, but only if projections are currently shown | |
| void | autoUpdateProjections_ () |
| slot that monitors the visible area changes and triggers the update of projections | |
Additional Inherited Members | |
| Static Public Member Functions inherited from EnhancedTabBarWidgetInterface | |
| static Int | getFirstWindowID () |
| the first object to be created will get this ID | |
| Static Public Attributes inherited from PlotWidget | |
| static const char | RT_AXIS_TITLE [] |
| static const char | MZ_AXIS_TITLE [] |
| static const char | INTENSITY_AXIS_TITLE [] |
| static const char | IM_MS_AXIS_TITLE [] |
| static const char | IM_ONEKZERO_AXIS_TITLE [] |
Widget for 2D-visualization of peak map and feature map data.
The widget is composed of two scroll bars, two AxisWidget and a Plot2DCanvas as central widget.
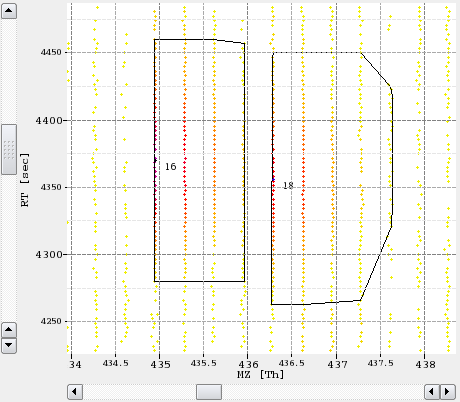
The example image shows Plot2DWidget displaying a peak layer and a feature layer.
Main managed data type (experiment)
| Plot2DWidget | ( | const Param & | preferences, |
| QWidget * | parent = nullptr |
||
| ) |
Default constructor.
|
overridedefault |
Destructor.
|
privateslot |
slot that monitors the visible area changes and triggers the update of projections
|
inlineoverridevirtual |
Returns a pointer to canvas object.
This method is overwritten for 1D, 2D, 3D to make the class specific members accessible.
The canvas object is set with the setCanvas_() method. This is usually done in the constructor.
Implements PlotWidget.
Referenced by TOPPViewBase::changeLabel(), TOPPViewBase::changeUnassigned(), TOPPViewBase::showCurrentPeaksAs2D(), TOPPViewBase::showCurrentPeaksAsDIA(), TOPPViewBase::showCurrentPeaksAsIonMobility(), and TOPPViewBase::updateToolBar().
| const Plot1DWidget * getProjectionOntoX | ( | ) | const |
const reference to the horizontal projection
Referenced by TOPPViewBase::showPlotWidgetInWindow().
| const Plot1DWidget * getProjectionOntoY | ( | ) | const |
const reference to the vertical projection
Referenced by TOPPViewBase::showPlotWidgetInWindow().
|
protected |
shows projections information
|
signal |
Emitted whenever the projections are shown or hidden; carries the actual (resulting) visibility. Used to keep the toolbar toggle button in sync with the real state.
Referenced by TOPPViewBase::showPlotWidgetInWindow().
| bool projectionsVisible | ( | ) | const |
Returns if one of the projections is visible (or both are visible)
Referenced by TOPPViewBase::updateToolBar().
|
overrideslot |
|
privateslot |
re-extracts the projections for the now-current layer, but only if projections are currently shown
|
inlineoverridevirtual |
set the mapper for the canvas and the projections (the non-marginal projection axis will be mapped to Intensity). Also tries to guess drawing (sticks vs line) and intensity mode
Implements PlotWidget.
References DimMapper< N_DIM >::getDim(), and DimBase::getUnit().
Referenced by TOPPViewBase::showCurrentPeaksAsIonMobility().
|
slot |
Single entry point to show (visible == true) or hide the projections. This is the only place that changes projection visibility, ensuring the projectionsVisibilityChanged() signal always reflects the actual state (e.g. a requested 'show' is reverted to 'hidden' if no peak layer is available).
|
signal |
|
signal |
Requests to display all spectra as 1D.
Referenced by TOPPViewBase::showPlotWidgetInWindow().
|
signal |
Requests to display this spectrum (=frame) in ion mobility plot.
Referenced by TOPPViewBase::showPlotWidgetInWindow().
|
overrideslot |
|
privateslot |
extracts the projections from the source_layer and displays them
|
signal |
Requests to display the spectrum with index index in 1D.
Referenced by TOPPViewBase::showPlotWidgetInWindow().
|
slot |
Toggles the visibility of the projections (convenience wrapper around setProjectionsVisible())
|
signal |
Signal emitted whenever the visible area changes.
| [in] | area | The new visible area. |
|
protected |
Group box that shows information about the projections.
|
protected |
Intensity maximum of the projection.
|
protected |
Vertical projection widget.
|
protected |
Horizontal projection widget.
|
protected |
Number of peaks of the projection.
|
protected |
Intensity sum of the projection.
|
protected |
Checkbox that indicates that projections should be automatically updated (with a slight delay)
|
protected |
Timer that triggers auto-update of projections.
 1.9.8
1.9.8 