Introduction
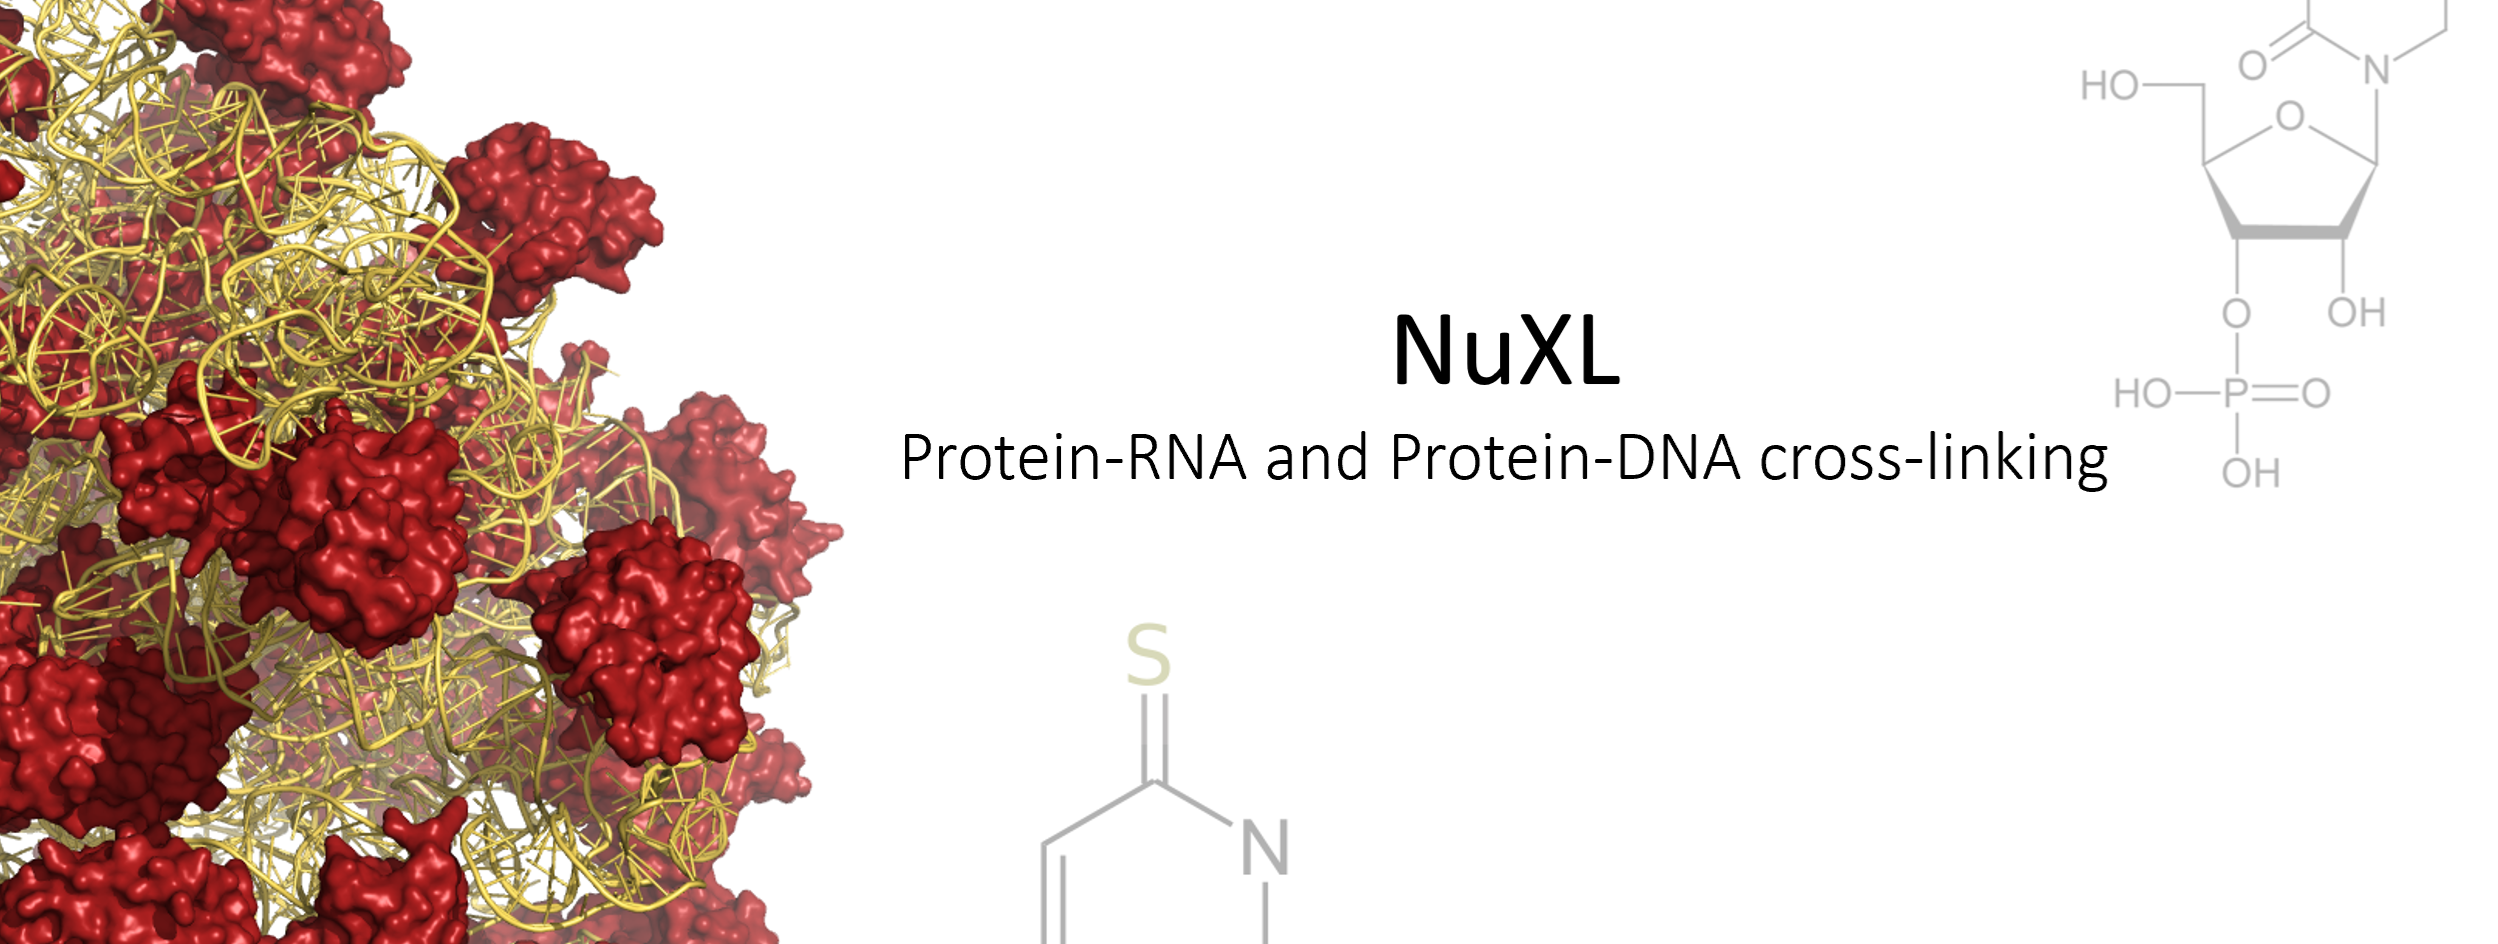
NuXL is a novel tool for protein-RNA and DNA cross-linking studies. It is available as a stand-alone tool and as a Proteome Discoverer community node or as a web application that doesn’t require you to install additional software. This guide outlines the steps to install NuXL, set up your analysis, and interpret your data using the provided tools and workflows.
Requirements:
- HCD data acquired on a high-resolution MS
- Developed and tested on orbitrap instruments (including Velos, Lumos, and Astral)
Installation for Proteome Discoverer
NuXL is currently compatible with Proteome Discoverer 3.0 and 3.1.
For PD 3.1 you need to:
- Download and install
PDNuXLNode_3_1.msifrom https://github.com/Arslan-Siraj/PDNuXLNodeInstaller/releases/tag/v0.0.3 - The installer will automatically detect your Proteome Discoverer installation directory and deploy the NuXL nodes correctly.
For PD 3.0 you need to:
- Download and install
PDNuXLNode_3_0.msifrom https://github.com/Arslan-Siraj/PDNuXLNodeInstaller/releases/tag/v0.0.2 - The installer will automatically detect your Proteome Discoverer installation directory and deploy the NuXL nodes correctly.
Note: After installation, open PD, go to
Administration -> Manage Licenses. ClickScan for Missing Featureson top of the list of available licenses on the right side of the PD window.
Troubleshooting
- Sometimes the operating system blocks the execution of .dlls copied from an external source. In these cases, it is necessary to go to the folder containing the .dll, right-click on it, choose properties, and then security. The dialog offers an option to unblock the .dll from execution.
Manuall installation
- If the installer fails, see the manual installation guide: https://github.com/Arslan-Siraj/PDNuXLNodeInstaller
Setting Up Your Study
-
Create a New Study:
- Open Proteome Discoverer
- Create a new study, define a root directory and study name (e.g.,
NuXL Study). If you set up your first NuXL study, leave(empty workflow)
-
Adding a Protein Database:
- Use the
Administration' ->Maintain FASTA file` option in Proteome Discoverer to add new protein databases to your project. Once configured, you can select this database in the NuXL node of the processing workflow.
- Use the
Analysis Workflows
-
Generating an analysis Template:
-
Click on
New Analysis. Note: Once completed, you will later find the analysis template in “Open Analysis Template”. -
In the analysis window you can set up ‘processing’ and ‘consensus’ workflows for NuXL
-
Processing Workflow
- Click on Edit in the ‘Processing Step’ window
- If you want to use a preconfigured workflow click
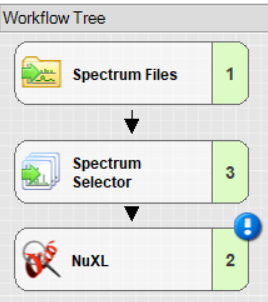
Openand select the template of your choice. - For a minimal workflow, add and connect
Spectrum Files,Spectrum Selector, andNuXLnodes. Note: You will find the NuXL node under theSequence Database Searchcategory.
-
Important settings in
Spectrum Selector: setMS OrdertoAnyto ensure MS1 spectra are not discarded. -
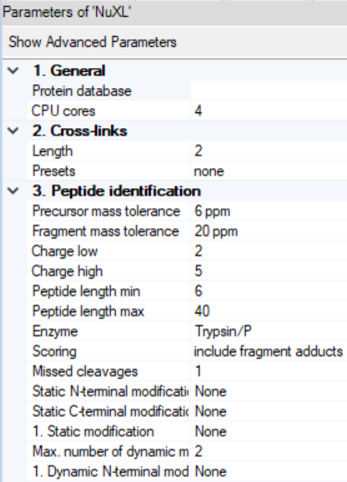
Configuring NuXL:
- By clicking on the NuXL processing node symbol in the workflow tree, you can adapt settings Note: If you click on
Show Advanced Parameter, you will find additional parameters. - NuXL provides
Presetsfor different crosslinking mass spectrometry protocols. For most use cases, users just need to select a preset that fits their experimental protocol. In most cases, default parameters work reasonably well but results can sometimes be improved by tweaking other parameters.
-
Other Parameters:
Peptide identification->Precursor mass toleranceandFragment mass tolerance: Adjust the fragment search mass accuracy according to your instrument.Peptide identification->Static modificationandDynamic modification: Note: Standard fixed modification (e.g.,Carbamidomethyl (C)) should be specified as Dynamic if the expected amino acid can form crosslinks, as otherwise these identifications would be lost.Cross-links->Length: Depending on your nuclease digestion protocol, you might expect different lengths of nucleotide adducts. NuXL is trained and tested on nucleotide adducts of 1-4 nucleotide length. For properly digested samples we recommend lowering the length value to 2. In most cases, the default value works well.Cross-links->Sequence: If your experiment involves a specific RNA or DNA species with a known sequence, it can be useful to enter the sequence in this field. The node then only considers possible nucleotide adduct combinations, potentially reducing false positives.Peptide identification->Peptide length min: For complex proteome searches, we recommend using the value6as the minimum amino acid count. For complexes of few proteins, that would allow manual validation this can be further decreased.Peptide identification->Peptide length max: We recommend setting a limit of ~30 for complex proteome-wide searches.Peptide identification->Missed cleavages: If significant crosslinking is expected to occur and create missed cleavages, the value can be increased up to 3.
-
Advanced users:
- Users can define their own fragmentation rules and crosslink adduct settings. Select
noneinPresets. You can then defineFragment adductsandModificationsin advanced parameters according to your protocol in the following format:[target nucleotide]:[formula]or[precursor adduct] ->[fragment adduct formula];[name]. NuXL will use this information to generate all chemically feasible precursor adduct and fragment adduct combinations. Cross-link identification->Can cross-link: If you expect only a single or subset of nucleotides to be amenable to crosslinking, set this up here. Nucleotides are specified by their one-letter code without a separator (e.g. UA for U and A nucleotides)Cross-link identification->Cysteine adduct: If DTT is present during UV irradiation, it can generate additional crosslinks including a 152 Da linker. For more information see 1. If needed to be identified, we recommend specifying the composition of the linker in modifications and ‘Fragment adducts’ instead. Set this flag to true, if the 152 adduct is expected.Cross-links->Target nucleotides: Sum formulas of the target nucleotides of the crosslink. Heavy labeled atoms are specified with parenthesis in front with the nominal mass of the respective isotope (e.g. (13)C, (15)N).
- Users can define their own fragmentation rules and crosslink adduct settings. Select
- By clicking on the NuXL processing node symbol in the workflow tree, you can adapt settings Note: If you click on
-
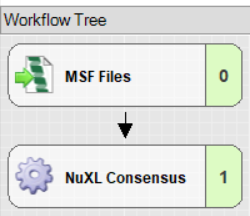
Consensus Workflow: Click on Edit in the ‘Consensus Step’ window
- Connect an
MSF Filesnode to the ‘NuXL Consensus’ node. - Set
Spectra to StoretoAllin the MSF Files node.
- Connect an
-
-
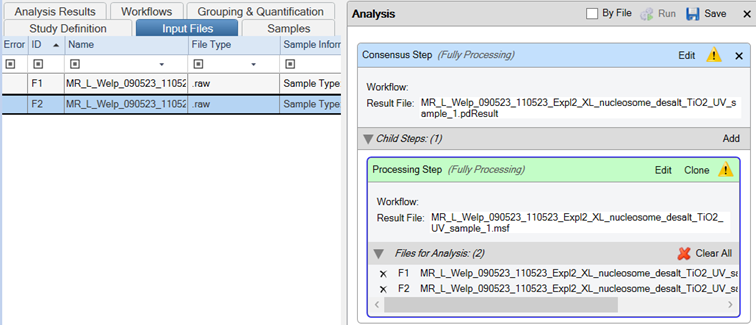
Running the Workflow:
- Drag and drop your Thermo Scientific .raw files onto the Processing Step in the Analysis tab
- Important: Ensure the “By File” checkbox is selected.
- Save the template
- Run the workflow
Post-Analysis
You can monitor the progress of your analysis by opening Administration -> Show Job Queue.
-
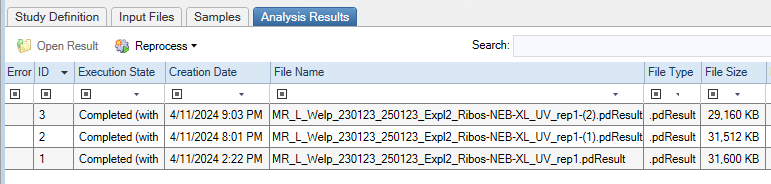
Viewing Results:
- Result files are not exported automatically. All results are listed under the Analysis Results tab. You can view your results in Proteome Discoverer by double-clicking the result file.
- Results are displayed in several tabs. You can view:
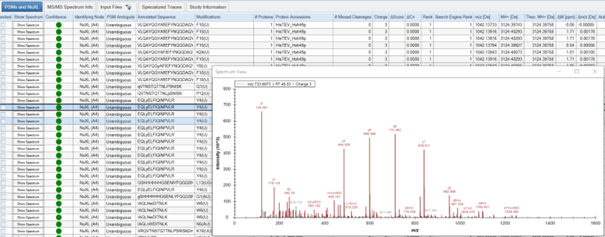
Proteins,PSMs and NuXL,MS/MS Spectrum Info,Input Files,Specialized Traces, andStudy Information. Depending on your consensus workflow, you might see additional tabs. - The
PSMs and NuXLtable provides information about all peptide and crosslink spectrum matches (PSMs and NuXLs, respectively). Key columns includeAnnotated Sequence,Modifications,Protein Accessions,q-value(CSM-level q-value). We recommend to filter your results for 1% CSM-level FDR (q-value<= 0.01).
-
Exporting Data:
- To export the results for further analysis in spreadsheet software (e.g., Microsoft Excel), navigate to
File -> Export -> To Microsoft Excel.
- To export the results for further analysis in spreadsheet software (e.g., Microsoft Excel), navigate to
-
Quality Assessment:
- You can manually validate spectra quality by viewing annotated spectra. To do so, click on the “Show Spectrum” button in the ‘PSM and NuXL’ tab.
- Assess features such as peptide sequence coverage and the presence of key ions.
Note: Please take a look at the Proteome Discoverer user guide for general information on Proteome Discoverer and additional nodes.
Installation as stand-alone tool
NuXL is developed using the OpenMS framework. Once installed, it is accessible through the OpenNuXL tool. OpenMS offers a suite of tools for graphical interfaces and command-line operations, compatible with Windows, MacOS, and Linux platforms. This guide focuses specifically on using the graphical application on Windows.
Alongside NuXL, the following core OpenMS software modules are also available and will be utilized in this tutorial. You can click on each term to access the respective documentation:
TOPPAS: A workflow design and processing tool that allows for the automated analysis of mass spectrometry data. TOPPView: A visualization tool that enables detailed analysis and review of mass spectrometric data. This step-by-step guide ensures you can leverage the full capabilities of NuXL and the associated OpenMS modules efficiently.
Downloading the OpenMS installer with NuXL.
Download the OpenMS-NuXL installer from https://github.com/timosachsenberg/OpenMS/releases/tag/NuXLPublication
Preparing the input files: Raw data conversion.
NuXL is compatible with Thermo raw files and also supports files that have been converted to the mzML format using freely available tools such as ProteoWizard’s msconvert. If you provide NuXL with Thermo raw files, it automatically utilizes the ThermoRawFileParser from Thermo Scientific™ for efficient data conversion. This flexibility ensures seamless integration with your existing data processing workflows.
Getting started – setting up a basic processing workflow.
Advanced users have the option to run the OpenNuXL tool directly from the command line, offering precise control over the tool’s functionality.
For those who prefer a more user-friendly setup, TOPPAS can be utilized to create streamlined workflows.
To begin, launch an empty workflow window by running the TOPPAS pipeline tool. This approach allows you to design and manage your workflows visually, making complex configurations more manageable and accessible.
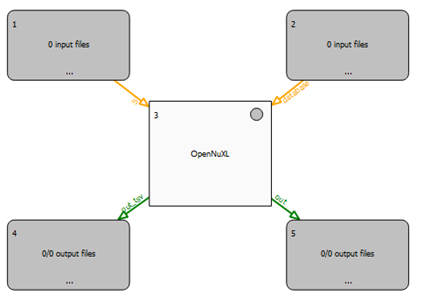
To build a workflow in TOPPAS, utilize the drag-and-drop functionality. You can start by selecting the required tools from the ‘TOPP tools’ pane on the left side of the TOPPAS window. A basic workflow typically includes the following components:
- Input Files Node: Designate nodes for input files labeled
<Input Files>. - Output Files Node: Set up nodes for output files labeled
<Output Files>. - OpenNuXL Node: This is found under the ‘utils’ collection and serves as the central processing node.
A workflow must include at least two input nodes. To connect these input nodes to the OpenNuXL node:
- Drag each node and drop it onto the workflow window.
- Connect the nodes to establish a connection.
Configure File: database [fasta] for one node and File: in [mzML, raw] for the other node as parameters in the pop-up window. As output options, you have the choice to select idXML (File: out [idXML], for spectrum annotations in TOPPView), tsv (File: out_tsv [tsv]), or xls (File: out_xls [xls]) output file formats.
Configuring Percolator in the OpenNuXL Node
To specify the path to the postprocessing tool Percolator within your workflow:
-
Access the Configuration Menu:
- Double-click on the OpenNuXL node. This will open the configuration menu.
-
Set the Path for Percolator:
- Find the field labeled
percolator_executable. - Enter the absolute path to the
percolator.exefile, typically found in the OpenMS installation directory at\share\OpenMS\THIRDPARTY\Percolator.
- Find the field labeled
-
Save Configuration Changes:
- After setting the path, click ‘Ok’ to save the modifications to the node settings.
-
Save the Pipeline:
- Go to the ‘File’ menu.
- Choose ‘Save’ to preserve your entire pipeline configuration.
These steps ensure that Percolator is properly integrated into your workflow, enhancing the robustness of data post-processing through the OpenNuXL tool.
With this step, the initial configuration of the OpenNuXL is completed and the pipeline can be saved from File -> Save as and used as a template.
Run Configuration
Preset Selection: Select a nucleotide adduct preset according to your workflow.
Depending on your experiment, you can select an RNA or DNA preset or define your own adduct settings for custom protocols:
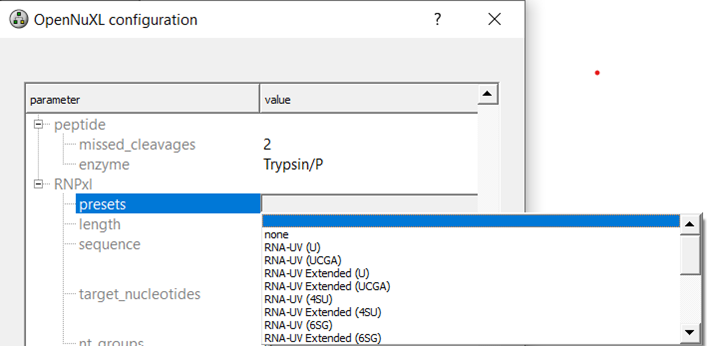
To view the MS1 (modifications) and MS2 (fragment_adducts) of the specific presets you can tick the box for advanced parameters and scroll to your preset of interest.
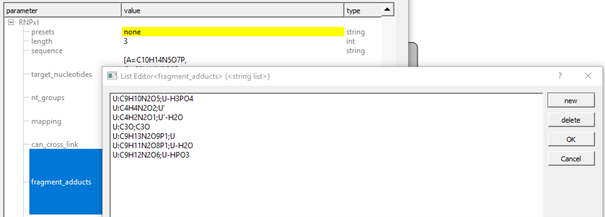
Advanced Users: Setting up Custom Nucleotide Adducts
In case none of the available presets matches your workflow, custom presets can be defined by defining ’target_nucleotides’, ‘can_cross-link’, ‘fragment_adducts’, and ‘modifications’.
If no preset is selected (’none’), you can add custom sum formulae in the same format as shown in advanced parameters for the presets (format: [target nucleotide]:[formula] or `[precursor adduct] ->[fragment adduct formula];[name];
Other settings
Numerous other parameters can be specified to fine tune the search process (Table T1). In most cases defaults combined with proper presets should work.
Table T1. OpenNuXL Parameters Editable by the User
| Parameter | Description | Comment |
|---|---|---|
NET_executable |
Path to .NET framework executable | Only required on linux and mac. |
ThermoRaw_executable |
Path to ThermoRawFileParser executable | |
database |
The protein database used for identification | |
out_tsv |
tsv output file | |
out_xls |
XL output file with group q-values calculated at the XL PSM-level. Generated for the highest FDR threshold in report:xlFDR. | |
output_folder |
Store intermediate files (and final result) also in this output folder | Convenient for TOPPAS/KNIME/etc. users because these files are otherwise only stored in tmp folders. |
percolator_executable |
Path to percolator executable of the installation e.g. ‘percolator.exe’ | If no percolator results are reported (“perc” idxml files) check if the path is correctly filled in. |
filter |
Filtering steps applied to results | |
window_size |
Peak window for spectra preprocessing | |
peak_count |
Retained peaks in peak window | |
log |
Name of log file (created only when specified) | |
debug |
Sets the debug level | |
threads |
Sets the number of threads allowed to be used by the TOPP tool | |
no_progress |
Disables progress logging to command line | |
force |
Overwrites tool-specific checks | |
test |
Enables the test mode (needed for internal use only) | |
precursor -> mass_tolerance |
Precursor mass tolerance (+/- around precursor m/z) | Adjust the precursor search mass accuracy according to the used instrument. |
precursor -> mass_tolerance_unit |
Unit of precursor mass tolerance | |
precursor -> min_charge |
Minimum precursor charge to be considered. | |
precursor -> max_charge |
Maximum precursor charge to be considered. | |
precursors -> isotopes |
Corrects for mono-isotopic peak misassignments. (E.g.: 1 = prec. may be misassigned to first isotopic peak) | |
fragment -> mass_tolerance |
Fragment mass tolerance (+/- around fragment m/z) | Adjust the fragment search mass accuracy according to the used instrument. |
fragment -> mass_tolerance_unit |
Unit of fragment mass tolerance | |
modifications -> fixed |
Fixed modifications, specified using UniMod (www.unimod.org) terms, e.g. ‘Carbamidomethyl (C)’ | Standard fixed modification (e.g. ‘Carbamidomethyl (C)’) should be specified as variable, if the expected amino acid can form crosslinks, as otherwise these identifications would be lost. |
modifications -> variable |
Variable modifications, specified using UniMod (www.unimod.org) terms, e.g. ‘Oxidation (M)’ | |
modifications -> variable_max_per_peptide |
Maximum number of residues carrying a variable modification per candidate peptide | |
peptide -> min_size |
Minimum size of a peptide considered in the search | For complex proteome searches, we recommend using 5 as minimum amino acid count. |
peptide -> max_size |
Maximum size |
Note: Each .raw/.mzML file will be processed separately and requires one database file to be added.
As an alternative to loading database files via an <Input Files> node, you can define the database in the OpenNuXL node by double-clicking the value field of the database parameter and selecting the respective database (Figure Database Configuration).
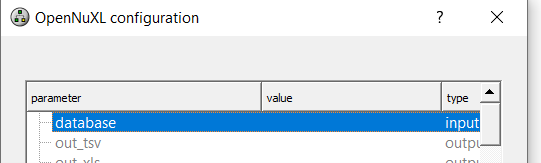
Figure Database Configuration: Within the OpenNuXL node, select the sequence database.
Advanced Users: In case you would like to combine several files in one search, we suggest using the OpenMS node <FileMerger>, which can be found in ‘File Handling’. The node needs to be combined with <Input Files>+<Collector> and <Output Files>.
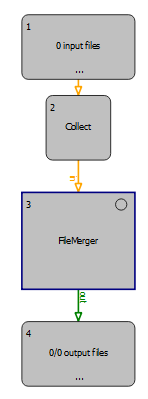
Figure Workflow to merge .mzML files: The <FileMerger> node can be used as shown in this scheme for merging .mzML files e.g., from multiple fractions.
To export FDR-filtered result files, specify the absolute path for an output folder by double-clicking the value field of the output_folder parameter and pasting your selected path.
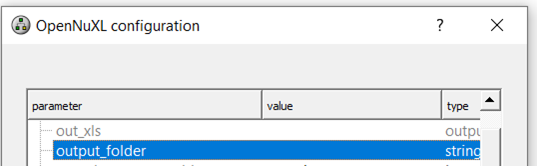
Figure Output folder path: To generate FDR filtered result files, a path needs to be specified.
OpenNuXL Pipeline Execution
After selection of analysis parameters and defining input files, the workflow can be executed by selecting ‘Pipeline’ -> ‘Run’ or pressing F5. A popup window asking to specify the output directory appears. Once specified, OpenNuXL analysis is started. All current tasks are displayed in the Log window below the workflow window. Unfiltered result files will be saved in the TOPPAS_out folder, which is automatically generated in the selected path.
Figure Output Directory.: Upon pipeline execution, the displayed pop-up window appears to enter the absolute path of the output folder.
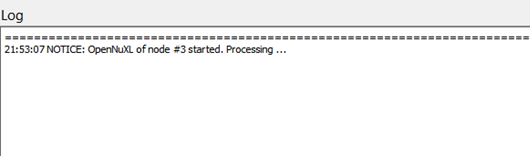
Figure OpenNuXL Log window.: The progress of OpenNuXL search is shown.
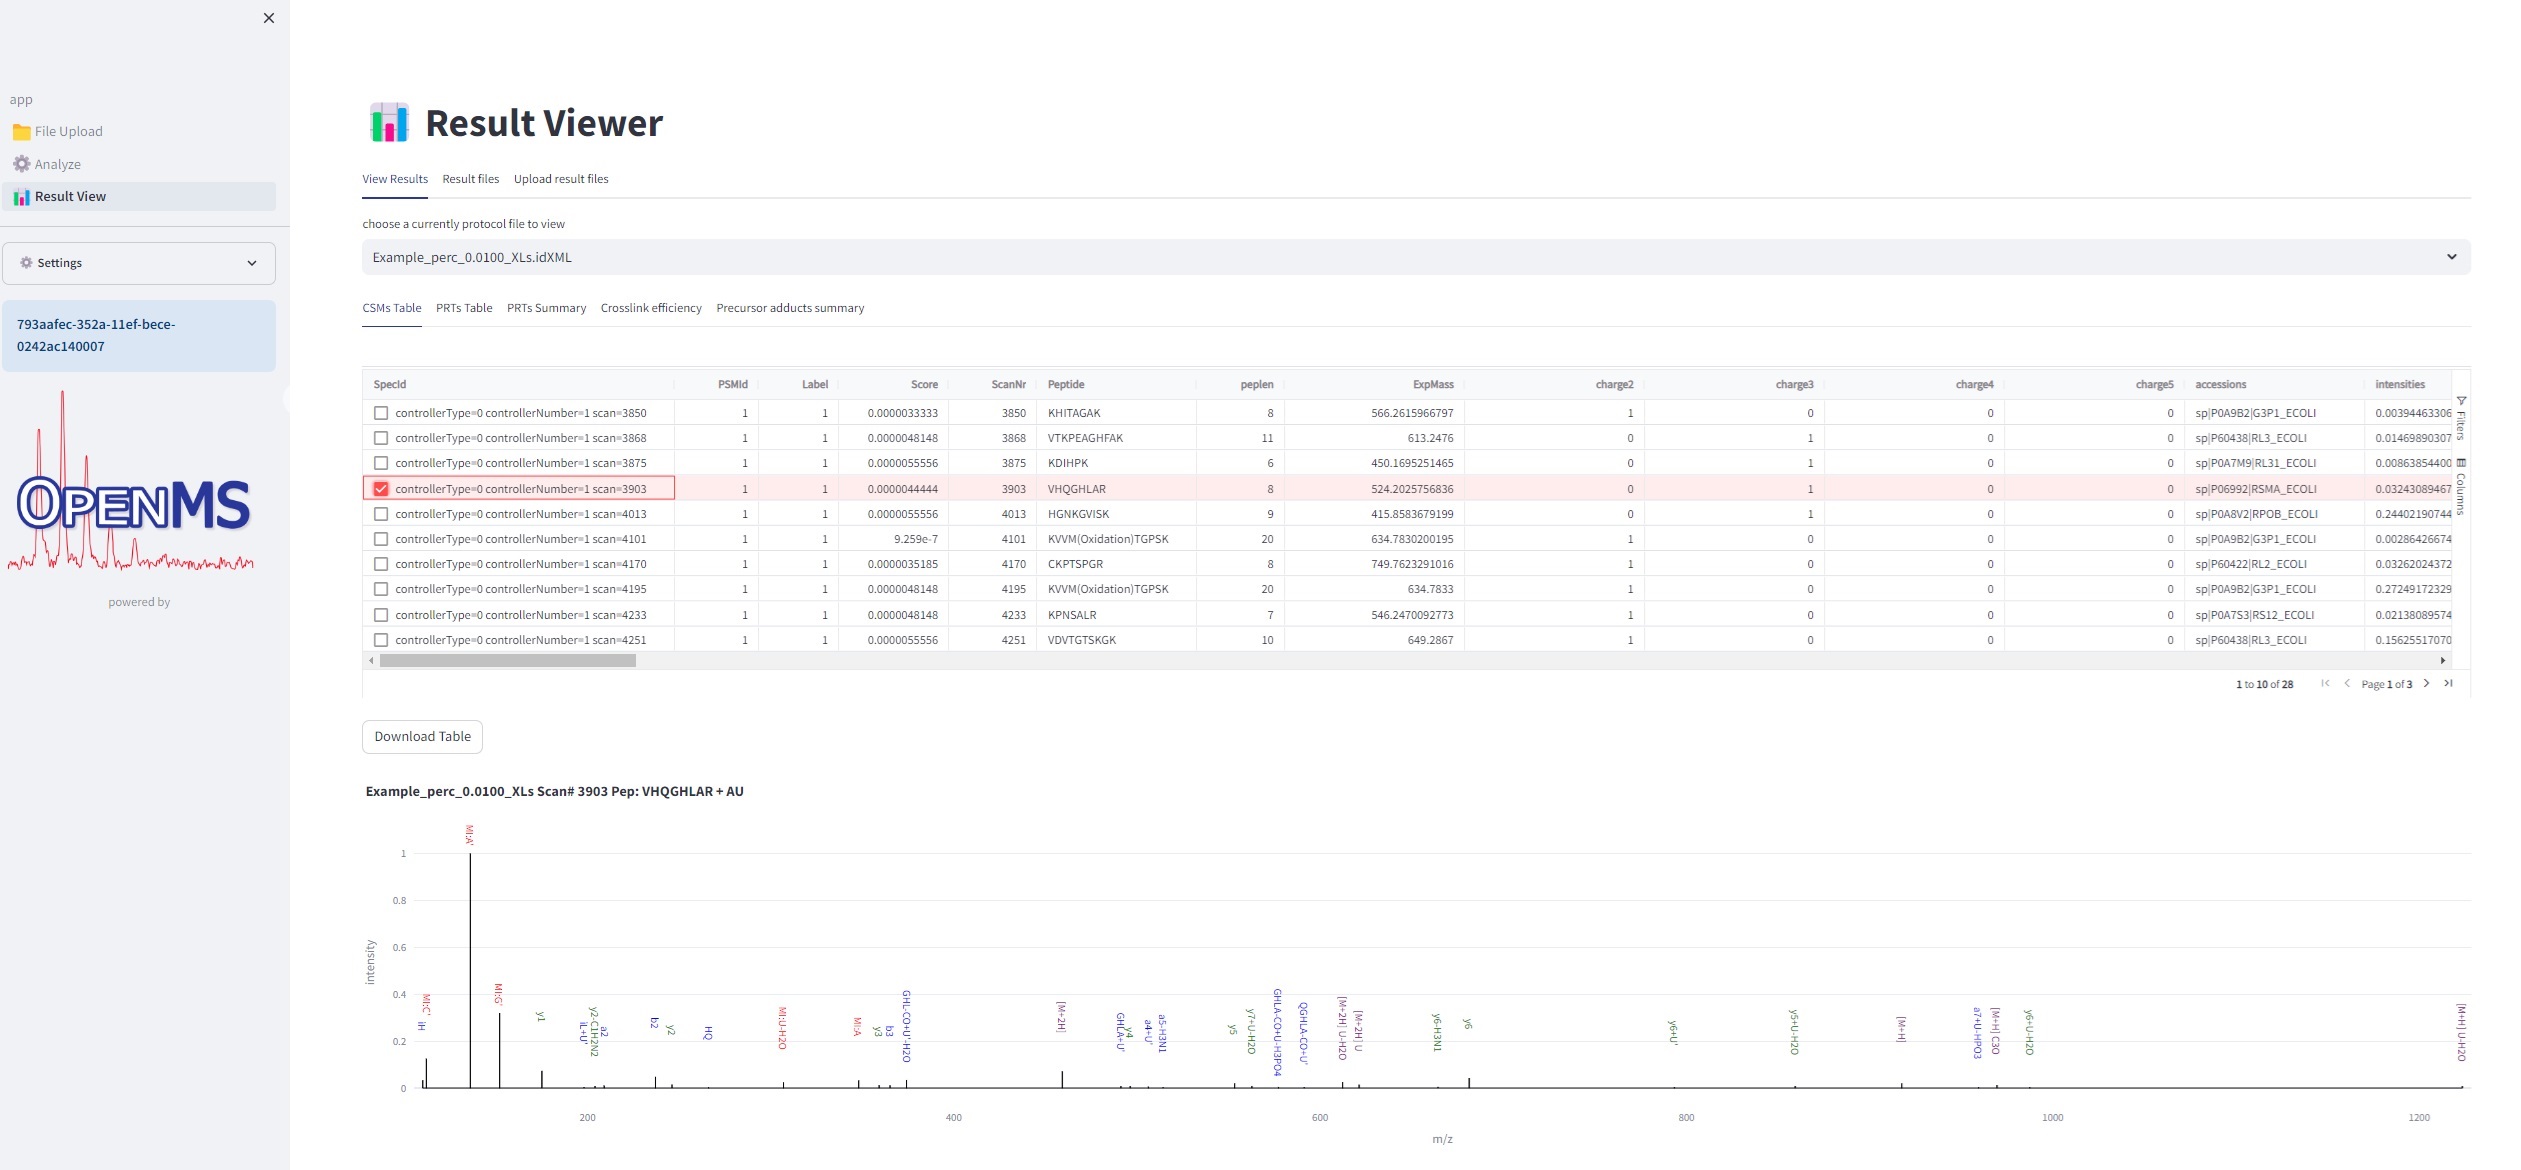
Result File Access - Visualization of Crosslinked Peptide-(Oligo)Nucleotide Spectra Using TOPPView
If executed on .raw files, the OpenNuXL node will create corresponding .mzML files in the output directory (defined as in Figure Output Directory). For visualization of annotated spectra, open .mzML files in TOPPView. By default, double-clicking on .mzML files should automatically open the file in TOPPView. Once it is loaded, spectrum annotations matched by OpenNuXL can be added by loading .idXML files generated by the tool. Select: ‘Tools’ -> ‘Annotate with peptide identifications’. See Figure Annotated MS2 Spectrum for an annotated MS2 spectrum of a UV-crosslinked peptide-RNA(oligo)nucleotide. To add/remove columns of the result grid ‘identifications’ below the spectrum window, right-click on the column header and a list of potential columns appears that you can choose from (Figure Custom columns).
Note: The FDR-controlled results for crosslinked and non-crosslinked peptides are available in the output_folder as defined in the OpenNuXL node. Results contain .csv, .tsv, and .idXML files. File suffixes indicate whether percolator rescoring was performed (’_perc’), on which level results are reported (’_proteins’, ‘_peptides’, or ‘_XLs’), and for which FDR the results were filtered (e.g., FDR of 1%, ‘_0.0100’). The ‘_ambiguous_masses.csv’ file contains precursor ion masses that match to…
Tip: You can export the TOPPView inbuilt result table by clicking on ‘Export table’ below the result grid.
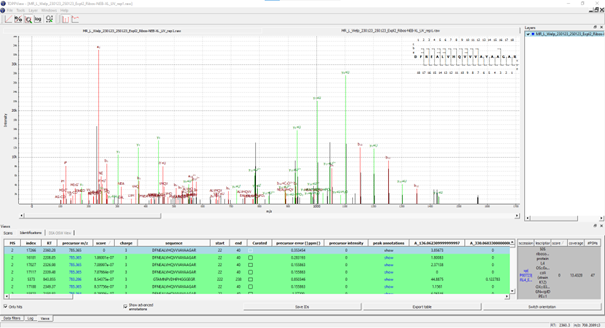
Figure Annotated MS2 spectrum: of a UV-crosslinked peptide-RNA(oligo)nucleotide displayed in TOPPView. The spectrum window shows OpenNuXL peak annotations in color (green and red) and unmatched peaks in black. The window contains the peptide sequence showing coverage with annotated fragment peaks.
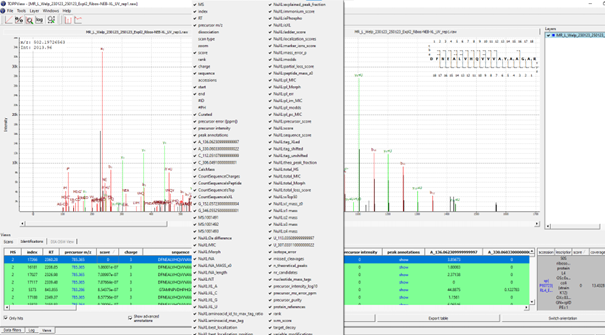
Figure Custom Columns: By right-clicking on the result grid header, a pop-up window appears that allows choosing different columns to be added/removed.
To export an image of the annotated spectrum, right-click on the spectrum and choose ‘Save’ -> ‘As image’. You then have the option to export the image as a vector or raster image.
Tip: You can add annotations manually by right-clicking on a peak. You can choose to define a label or an annotation (‘Add label’, ‘Add peak annotation’) and/or to display the m/z value (‘Add peak annotation mz’).
Run as Web-Application
Please visit https://abi-services.cs.uni-tuebingen.de/nuxl/ to try out (or download) the experimental NuXL web app.